


Learn how to convert Excel files into interactive Canvas Apps using Power Apps with this step-by-step guide on data management empowerment. Follow these detailed instructions to import an Excel file, convert it to tables, and create a Canvas App within Power Apps.
1. Prepare the Excel File:
– Ensure the Excel file is properly structured with column headers and consistent data formatting.
– Remove any unnecessary rows or columns not required for the app.
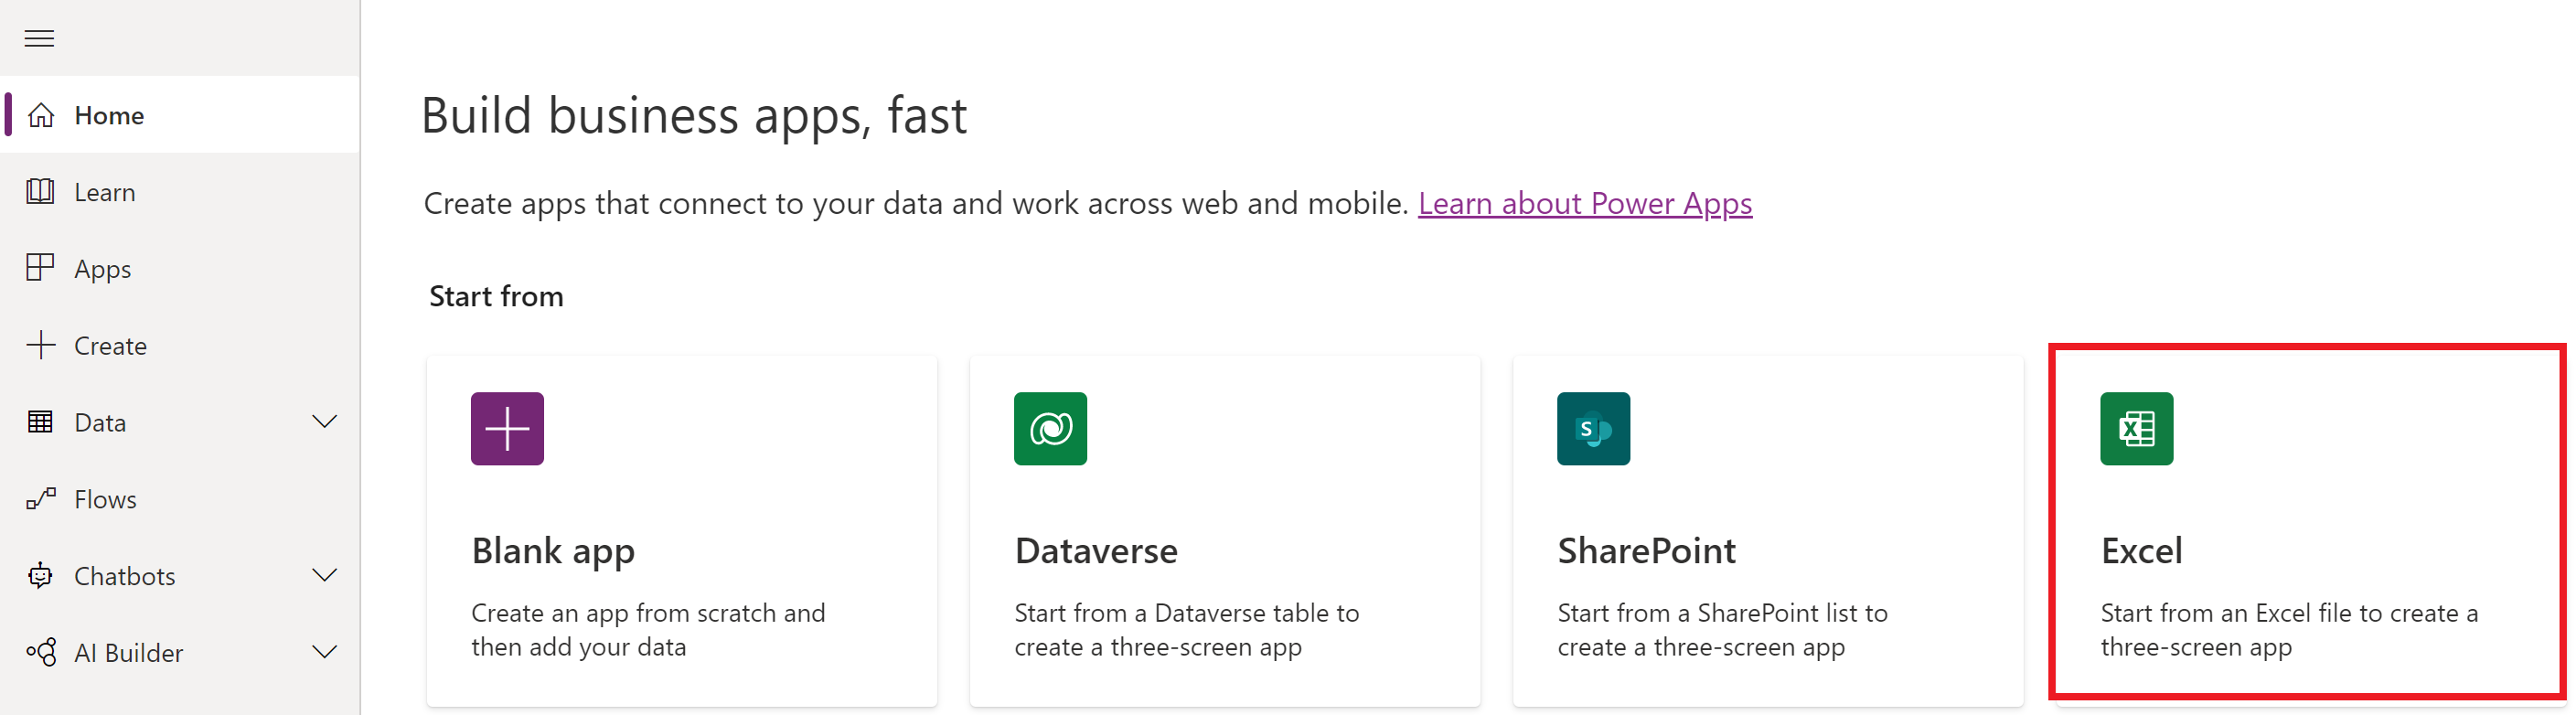
2. Create a New Canvas App:
– Open Power Apps and create a new blank canvas app.
– Choose a layout and orientation suitable for your app’s design.
3. Add a Data Source:
– Click the “Data” tab and select “Add data source.”
– Choose “OneDrive for Business” or “SharePoint” as the data source, depending on where your Excel file is stored.
– Connect to your OneDrive or SharePoint account and select the Excel file you want to import.
4. Import the Excel Data:
– From the “Data” tab, click “Import” and choose the Excel data source you added.
– Power Apps will display a preview of the Excel data.
– Click “Connect” to import the data into your canvas app.
5. Create Tables:
– From the “Insert” tab, select “Data table” and choose the layout that fits your requirements.
– Bind the table to the imported Excel data by selecting the data source and specifying the table name.
– Power Apps will automatically generate columns based on the Excel data.
6. Customize Table Layout and Functionality:
– Customize the table’s appearance by selecting it and accessing the “Properties” pane.
– Adjust column widths, apply formatting, and set sorting or filtering options.
– Add additional features like search boxes or pagination as needed.
7. Add Form Controls:
– Add form controls to the canvas app to allow users to edit the Excel data.
– From the “Insert” tab, choose “Edit form” or “Display form” based on your requirements.
– Bind the form control to the Excel data source and specify the relevant columns.
8. Implement Data Manipulation and Validation:
– Use Power Apps formulas and functions to implement data manipulation and validation logic.
– Apply formulas to calculate values, validate input, or perform data transformations.
– Use the Power Apps formula bar or the control properties pane to define these formulas.
9. Test and Refine:
– Preview and test your canvas app to ensure the imported Excel data is displayed correctly in tables and forms.
– Validate the functionality of data manipulation and any custom logic you implemented.
– Iterate on the app design, layout, and functionality based on user feedback or further requirements.
10. Publish and Share:
– Once satisfied with the app, publish it to make it available for users.
– Share the app with intended users or embed it in other platforms like Microsoft Teams or SharePoint.
Conclusion:
Embrace the power of Power Apps and the ease of converting Excel data into an interactive canvas app. This integration will undoubtedly boost productivity, improve data management, and enhance overall efficiency for your team or organization. This technique allows you to streamline processes and transform raw data into actionable insights, empowering your team to achieve more in less time.